According to statistics from U.S. Census Bureau in 2016, the median housing price in California is much higher than thoes in U.S for over 50,000 dollars. The reasons are not only overwhelm demanding from residents or prospective residents but also the extraordinary price changes inside California.
Although the median housing price is relatively high, we still can know more about regions where are worthwhile to invest and where should be avoided buying house with unreasonable price.
We will use Zillow housing price data for each counties in California and some features to find the best combination of feature of house with housing price and let people know more about housing price in California.
Year Range : 1996-2007
Unit : Analysis based on counties in California
Housing Price : Median Price in different types of house and counties
Features : Unemployment rate, Annual Income, Population, Criminal Rate, and School Scores
Time-Series Data : The housing price from 1996 to Jun 2007 was increased. However, after mid-year 2007, the price decreased sharply. One of the main reasons is the "subprime mortgage crisis" and a collapse of housing bubble started from December 2007 to June 2009. For the fill with gray is the error bar with one standard deviation. You can find that even in the California, in different counties still have significant difference in the median housing price. Therefore, we nee to discuss every county seperately later.

Median All-home price and Unemployment Rate : It’s clear that they might exist negative relationships. When the unemployment rate falls, the median housing price will increase. This might because that the district might be in good economic times when the unemployment rate decrease. Therefore, people would be richer and tend to buy an estate.

Criminal Rate From 2005 to 2015 : The size of the points depend on value of the housing price those years. The value in 2016 can be seen as outlier or unnormal case. For the points in other years we can find out a decrease trend of criminal rate through time. But there is a slightly increase for criminal rate in 2015. For housing price, there is also a decreasing trend from 2006 to 2012 and housing price started to increase from 2013 to 2015.

Overall features vs. Housing Price : Unemployment rate decreaesed when sold price increaseed in 2015 and when school scores increased. Because the distribution of Crime and Population are lefe-skew, we took log tranformation to those two features. Log-transformed Population has negative relation with income per person. Log-transformed Crime has negative relation with Log-transformed Population.

Compound Annual Growth Rate(CAGR) for recent five year (2012-2016) : CAGR in Colusa, San Benito, Stanislaus, and Solano, and San Joaquin have highest positive growth rate. On the other hand, Del Norte, the northest county in California, is the only one with negative growth rate.

Housing Price between Southern and Northen California : Price in Northern and Southern are distributed differently. However, their mean are close. To test if two price mean are the same, we do the two-sample t test with the null hypothesis that the difference of two mean of housing price are zero. Base on the result of hypothesis, the p-value is large. We can conclude that two price mean are the same.

Schools scores distribution : This is a county level choropleths map showing the trend of school scores 2016 obtained from Schooldigger. In the map, the more red the region is, the higher school score the county has. For general trend, we can see that northern California is doing better than southern part of California. There are more red regions around San Francisco. Here is the raking : Marin (0.7644), San Jose (0.73), San Francisco (0.7242). They are all located at northern California. If we take a closer look at southern part of California, the highest score region is Irvien (0.6744). The second runner up is Santa Barbara (0.6471). Because Los Angeles has the most number of schools in California, the score range may be quite different. It does not the top rank county in southern part of California. The average score is 0.57.

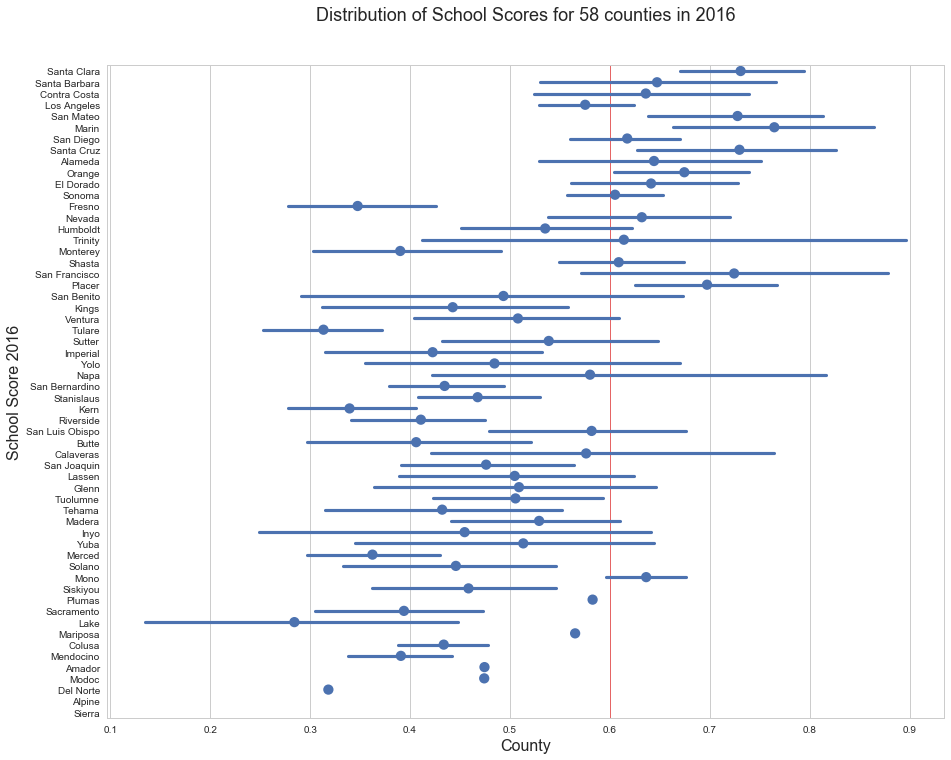
Picture in the below shows the variance of school scores in each county. It is interesting to see that the variance of los angeles is not huge. That means the reason Los Angeles is not the top rated county for school is that all the school scores in Los Angeles are not high. Marin, San Jose and San Francisco all have smaller variance. That means all the schools in those counties perform well.
Schools scores distribution Vs. Housing prices : This interactive plot shows the relationship between average median sold house price from zillow in each county and school scores in 2016. The size of the bubble depends on the number of schools in that county. The larger the bubble, the more school that county has. We can see that there is a positive correlation between these two variables. The higher the school score, the higher average sold house price. San Mateo and Marin have a good combination of the two.Tulane and Fresno have lowest school scores and average sold house price. The general trend is the same as the one in 2015. However, some counties has shifts in postion. For example, lake county has lower average school scores but higher average median sold house prices.

According to time series analysis, each county in California has similar pattern with the overall sold price except San Francisco whose housing price did not decrease much even during the subprime mortgage crisis. Housing inventory dataset shows that house supply in California has negative relation with sold price. Both unemployment rate and criminal rate present negative relationship with housing price.
By analyzing different features that might relate to sold price in spacial aspect, we find out that almost all counties in California have positive growth rate of housing price from 2012 to 2016. Even though school scores in Northern California have higher value than those in Southern California, there is no difference of housing price between Southern and Northen California. What's more, income does not show significant relationship with housing price after exploring data in different counties. But there present positive relationship of sold price and school scores. Unemployment rate exhibit negative relationship with housing price.
In sum, after comparing all those results for each county, we think Orange county is the most appropriate county when choosing to buy a house in California.
Open to any opportunities to build my career in data science related position. If you are interested in any projects, work, and travel experience, please contact me.